Skip to work

From raw data to shipped systems.

I'm Ates, an Industrial Engineering student at TU/e. I'm looking for a supply chain or operations analytics internship for summer 2027.

Modelling is the slowest step, so jobs pile up in front of it.

Each box is a step from raw data to a finished product, and each blue square is a job. Most of a job's time is spent waiting in a queue, not being worked on. Tap a step to improve it; tap again to undo.

Total time per job0.0 s

Three stations, one line of work.

Each project starts as an operations or money question and ends as software someone can use. Try them here.

Demand Forecaster

Industrial Eng.

Forecasts daily demand for 500 store-item series, flags which products run out before the next delivery, and says how much to order.

Problem
A store must reorder before it runs out. Which of 500 products will stock out before the next delivery, and how much should be ordered?
Data
Kaggle Store Item Demand Forecasting Challenge: 10 stores by 50 items, daily sales from 2013 to 2017.
Method
A SARIMA baseline on one series, then one global XGBoost model with lag, rolling and calendar features across all 500. One global model learns the shared weekly pattern and scales; 500 separate SARIMA fits do not.
Result
SARIMA on one series scored MAPE 33.4% and MASE 1.01, no better than repeating last week. XGBoost across all 500 scored MAPE 13.6% and MASE 0.74. 178 of 500 products run out within a 14-day delivery window; each gets a safety stock and reorder point at the chosen service level.
Series modelled
500
At risk in 14 days
178
XGBoost MAPE
13.6%
MASE vs naive
0.74
  • Python
  • XGBoost
  • SARIMA
  • Streamlit

store 9 · item 1

Runs out on day 13, before delivery

112234forecast starts 2017-10-03deliveryruns out
Service level
On hand (simulated)
330
Forecast demand until delivery
378
Safety stock
29
Reorder point
406

Order now77 units

Real backtest: grey is what sold, blue is the XGBoost forecast. Safety stock = z × σ × √days, with σ the daily forecast error.
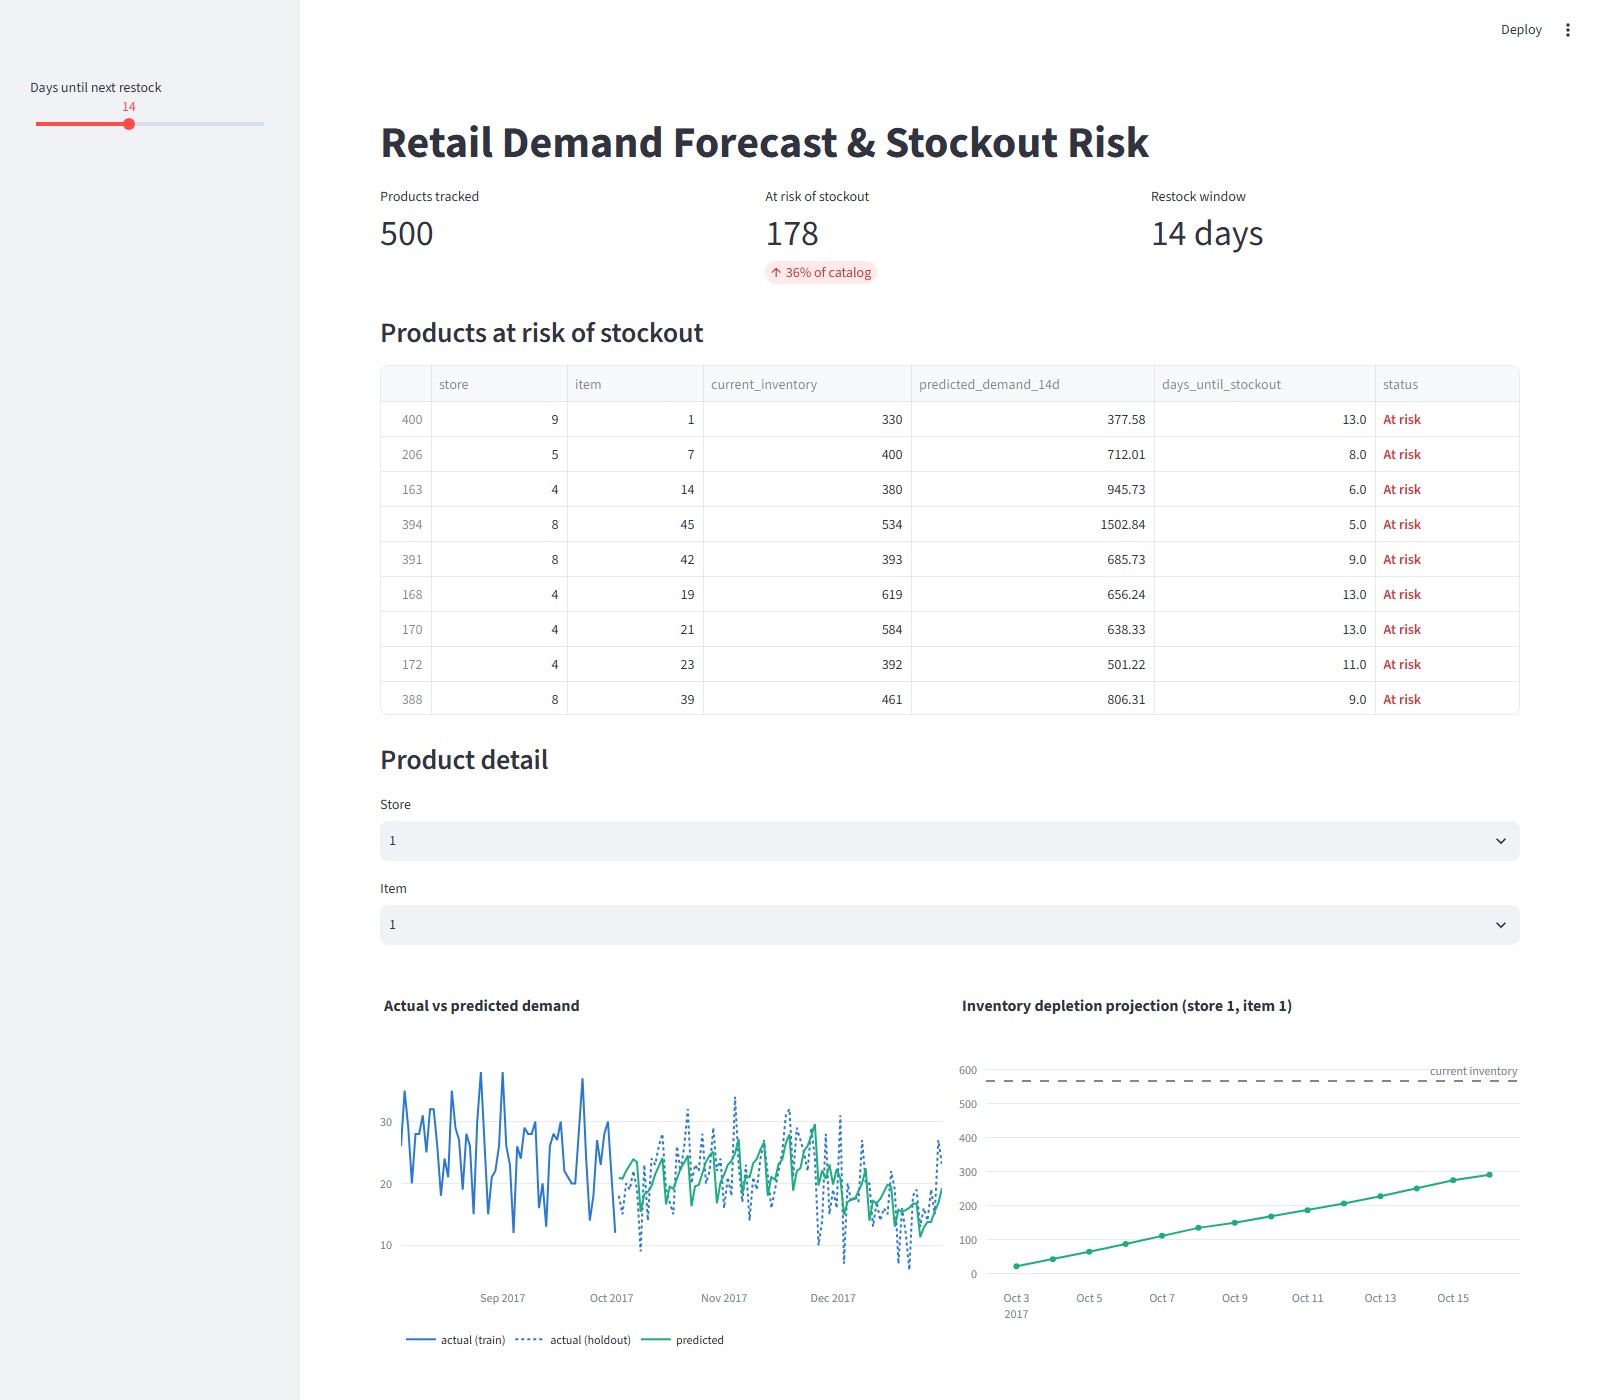
The Demand Forecaster Streamlit dashboard: 500 products tracked, 178 at risk of stockout, a 14-day restock window, and a table of at-risk products.
The shipped Streamlit dashboard.

NVIDIA CORP

10-K filed 2026-02-25

Evidence from the filing

“During fiscal year 2026 and fiscal year 2025, we spent $6.1 billion and $3.4 billion on capital expenditures, respectively. We expect to increase capital expenditures in fiscal year 2027 relative to fiscal year 2026 to support the future growth of our business.”

Real output from the app's demo mode. Quotes come straight from each 10-K.

SEC Filing Analyzer

Finance

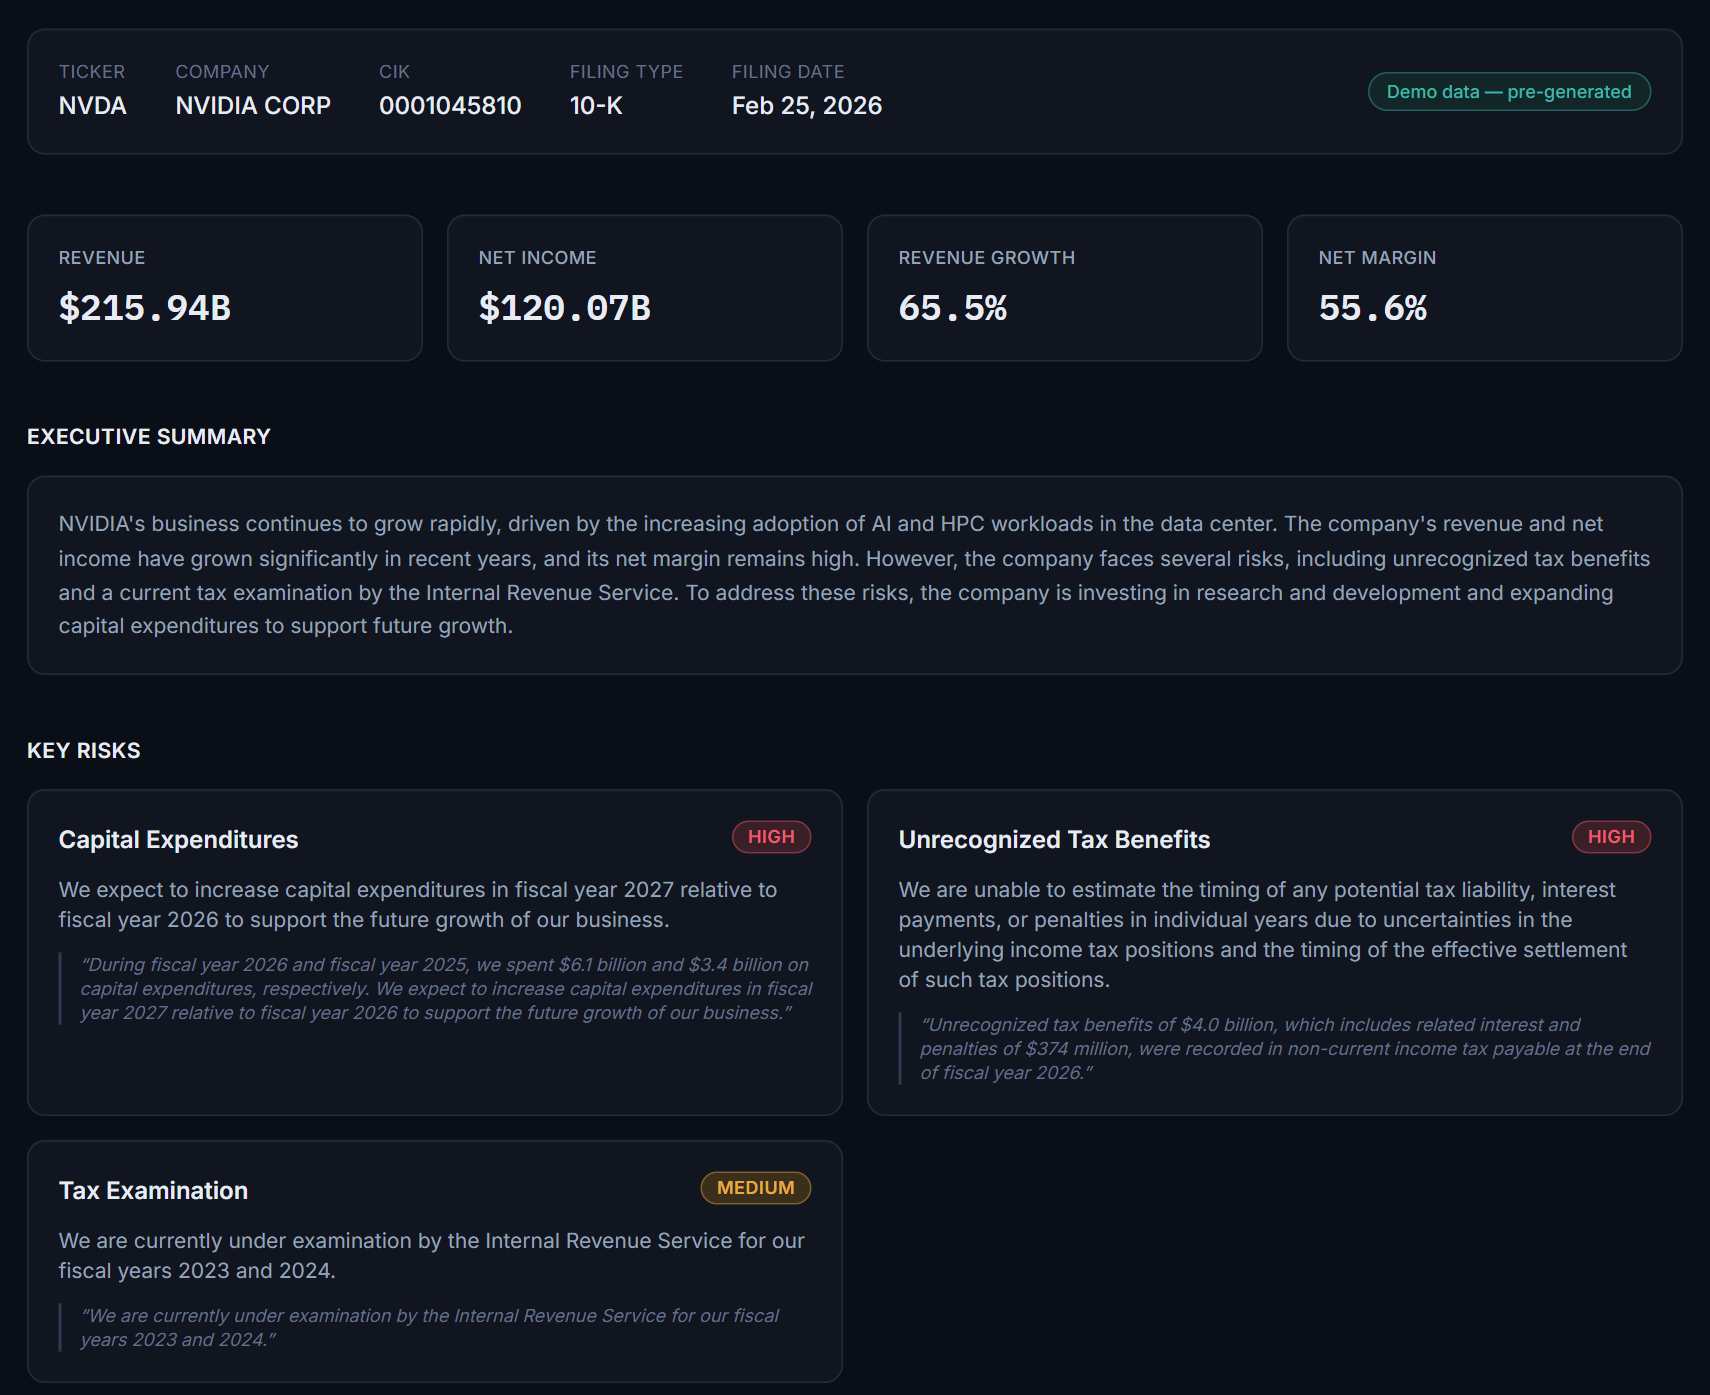
Reads 10-K and 10-Q filings and returns risks, growth bets and priorities, each tied to a quote from the filing itself.

Problem
A 10-K takes hours to read, and the change that matters is buried in legal boilerplate.
Data
SEC EDGAR filings (Business, Risk Factors and MD&A sections) and SEC XBRL financial data.
Method
The model reads only the extracted sections and must return strict JSON with a quote behind every claim. Every number is computed in Python from XBRL, never by the model, because language models invent figures.
Result
Five companies open instantly in demo mode; any other filing runs on a free local model. Found and fixed a data bug: NVIDIA changed its XBRL revenue tag after FY2022, which had silently dropped four years of revenue.
  • FastAPI
  • React 19
  • TypeScript
  • Ollama
  • SEC XBRL
The SEC Filing Analyzer on NVIDIA's 10-K: revenue $215.94B, net income $120.07B, 65.5% revenue growth and 55.6% net margin, an executive summary, and three key risks each backed by a quote from the filing.
The shipped app, analyzing NVIDIA's 2026 10-K.

Discount Policy Simulator

Operations

Finds where a retailer loses money on 51,290 order lines and lets you test a discount cap before anyone changes a price.

Problem
Discounts win orders, but which ones cost more than they earn, and what policy would stop it?
Data
Global Superstore: 51,290 order lines across 7 markets and 3 categories, 2011 to 2014.
Method
Cleaned in pandas, margin by discount level in Python and SQL, then a what-if model that re-prices orders above a cap from their implied list price and cost, with customer retention as an explicit assumption.
Result
Above 20% off, every category loses money: those orders lost $815k. A 20% cap lifts profit from $1.47M to between $2.28M, if those customers all leave, and $2.50M, if they all stay.
  • Python
  • pandas
  • SQL
  • JavaScript
Category

Profit on the same orders

$2.39M

+$923k vs $1.47M today

nobody stays $2.28Meveryone stays $2.50M

Margin by discount level

  • 0%
    +25.2%
  • 1-10%
    +16.5%
  • 11-20%
    +9.7%
  • 21-30%
    −5.6%
  • 31-50%
    −32.4%
  • over 50%
    −111.0%

Crossed-out levels are above your cap. Their orders are re-priced at the cap: list price is sales / (1 − discount), cost is sales − profit, and only the share of customers you set is kept.

Real data: 51,290 Global Superstore order lines, 2011 to 2014.

These three are the ones I'd show first. More projects and experiments live on GitHub.

More on GitHub

I study how work flows, then write the software that makes it flow better.

Industrial Engineering taught me to see queues, bottlenecks and wasted steps. Finance taught me to read what a company says about itself. Code lets me act on both.

Most of my projects start with a spreadsheet or a filing and end as a tool someone can open in a browser.

Study
B.Sc. Industrial Engineering, TU/e, 2025 to 2028
Languages
Turkish (C2), English (C1), Dutch (A1)
Coursework
Statistics, Data Analytics, Algorithmic Programming, Business Information Systems, Financial and Managerial Accounting
Outside work
Tennis, padel, fitness and following the markets
Based in
Eindhoven, Netherlands

Industrial Engineering

Demand forecasting
Forecaster
Stockout risk
Forecaster
Pricing policy analysis
Discount Simulator
Flow analysis
this page

Finance

10-K / 10-Q analysis
SEC Analyzer
XBRL financial data
SEC Analyzer
Profit and margin
Discount Simulator
Financial accounting
TU/e coursework

Full-stack

React, TypeScript
SEC Analyzer
FastAPI
SEC Analyzer
Python, pandas, SQL
Discount Simulator
Streamlit
Forecaster

Pull the next project.

I'm looking for a supply chain or operations analytics internship for summer 2027. If you have one, a project or a question, send the signal.

Email meCV

© 2026 Ates Parilti

Back to top

Built with React and a small discrete-event simulation.